Windows Server performance monitoring refers to the range of processes involved in tracking the server’s key metrics, to ensure excellent performance. Windows Server includes some basic built-in tools for analysis and troubleshooting that let you monitor four key aspects of performance, including the server’s CPU, memory, hard disks, and the network interface card (NIC). You can examine various metrics related to these components to see whether the server is behaving as expected.
Task Manager:
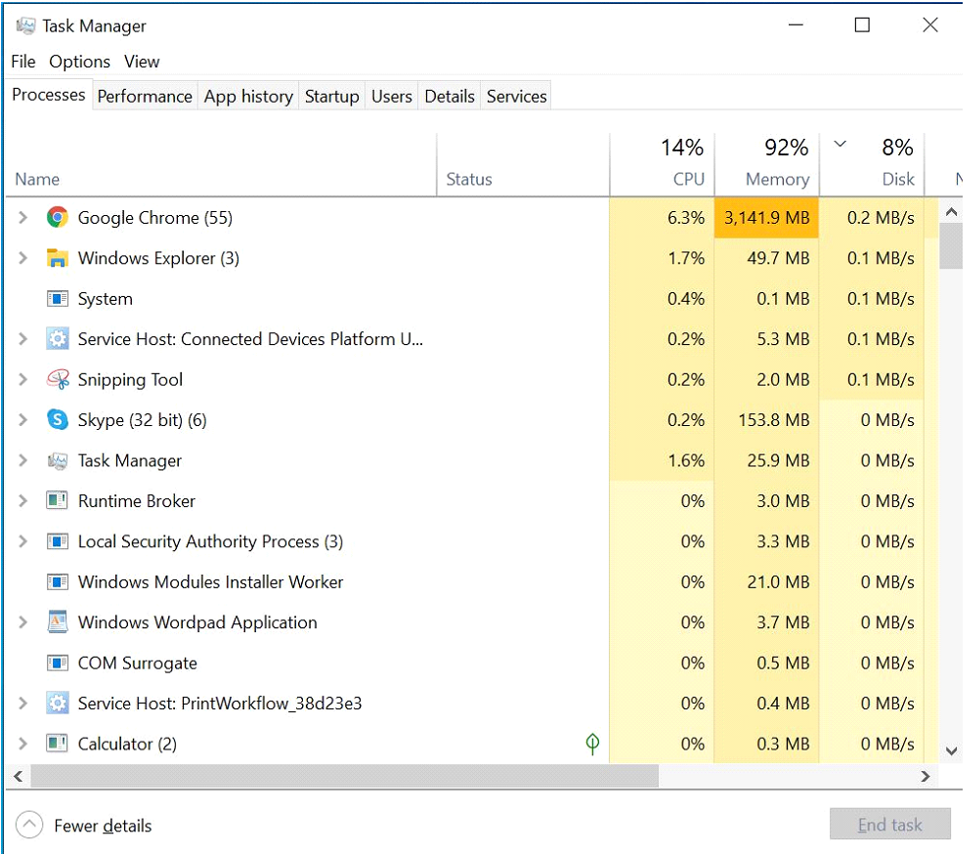
The Windows Task Manager is a powerful tool packed with useful information, from your system’s overall resource usage to detailed statistics about each process.
Windows offers many ways to launch the Task Manager. Press Ctrl+Shift+Esc to open the Task Manager with a keyboard shortcut or right-click the Windows taskbar and select “Task Manager.” You can also press Ctrl+Alt+Delete and then click “Task Manager” on the screen that appears or find the Task Manager shortcut in your Start menu.
Task manager tabs explained:
1.Processes: A list of running applications and background processes on your system along with CPU, memory, disk, network, GPU, and other resource usage information.
2.Performance: Real-time graphs showing total CPU, memory, disk, network, and GPU resource usage for your system. You’ll find many other details here, too, from your computer’s IP address to the model names of your computer’s CPU and GPU.
3.App History: Information about how much CPU and network resources apps have used for your current user account. This only applies to new Universal Windows Platform (UWP) apps—in other words, Store apps—and not traditional Windows desktop apps (Win32 applications.)
4.Startup: A list of your startup programs, which are the applications Windows automatically starts when you sign into your user account. You can disable startup programs from here, although you can also do that from Settings > Apps > Startup.
5.Users: The user accounts currently signed into your PC, how much resources they’re using, and what applications they’re running.
6.Details: More detailed information about the processes running on your system. This is basically the traditional “Processes” tab from the Task Manager on Windows 7.
7.Services: Management of system services. This is the same information you’ll find in services.msc, the Services management console.
The Performance tab shows real-time graphs displaying the usage of system resources like CPU, memory, disk, network, and GPU. If you have multiple disks, network devices, or GPUs, you can see them all separately.
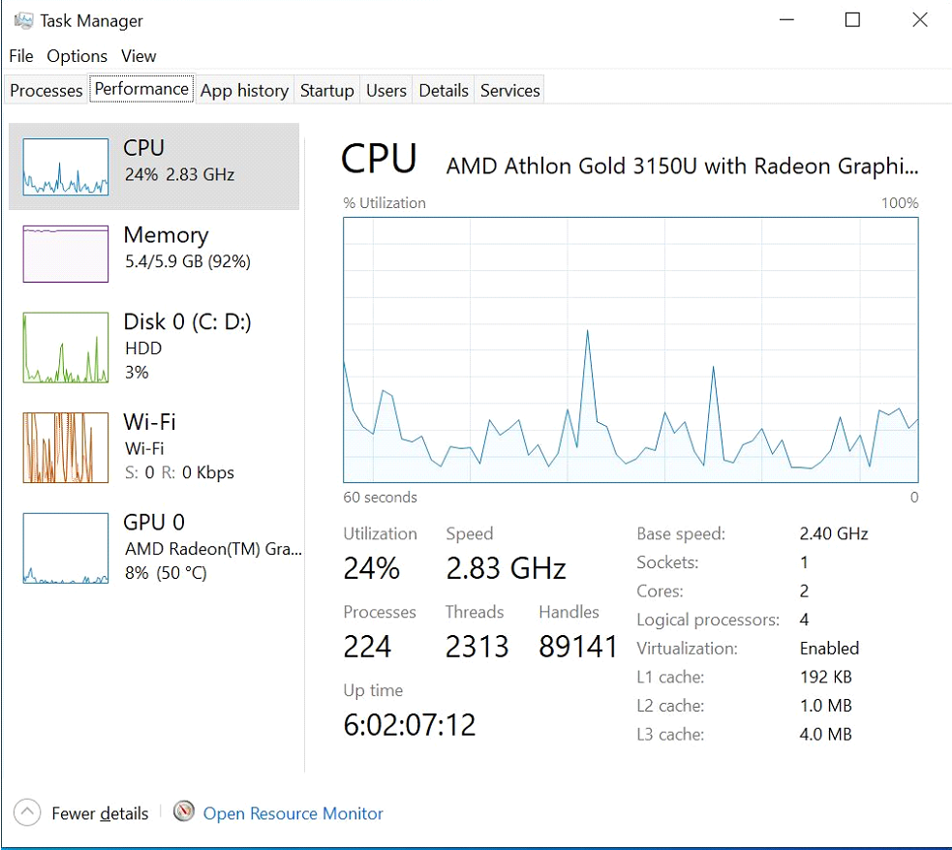
1.CPU: The name and model number of your CPU, its speed, the number of cores it has, and whether hardware virtualization features are enabled and available. It also shows your system’s “uptime,” which is how long your system has been running since it last booted up.
2.Memory: How much RAM you have, its speed, and how many of the RAM slots on your motherboard are used. You can also see how much of your memory is currently filled with cached data. Windows calls this “standby.” This data will be ready and waiting if your system needs it, but Windows will automatically dump the cached data and free up space if it needs more memory for another task.
3.Disk: The name and model number of your disk drive, its size, and its current read and write speeds.
4.Wi-Fi or Ethernet: Windows shows a network adapter’s name and its IP addresses (both IPv4 and IPv6 addresses) here. For Wi-Fi connections, you can also see the Wi-Fi standard in use on the current connection—for example, 802.11ac.
5.GPU: The GPU pane shows separate graphs for different types of activity—for example, 3D vs. video encoding or decoding. The GPU has its own built-in memory, so it also shows GPU memory usage. You can also see the name and model number of your GPU here and the graphics driver version it’s using. You can monitor GPU usage right from the Task Manager without any third-party software.
Causes and fix for High CPU Usage
Finding the core of the problem helps you implement better solutions for high CPU usage. There can be various reasons for CPU usage based on use-cases.
Processes With High CPU Requirement
Some programs require high CPU resources. If you have a low specification system and are trying to run a high-end video game, obviously the CPU usage will go through the roof. Similarly, there can be different processes that require high CPU resources in order to work. Such processes or a number of processes which as a subtotal utilize high CPU can be one of the causes. On servers, running multiple services to keep the server running, simulations, etc., can cause high CPU usage.
Background Processes
Processes can be primarily divided into 2 categories: system processes and application processes. System processes are the processes that are needed in order to keep your system running. Application processes are the processes that you’d use for a specific purpose. When these processes keep running in the background, they eat up CPU resources.
A lot of application processes keep running in the background even after you close the application window. This is less likely to happen on a server because a server is usually maintained and cleaned periodically to have only the processes it needs but it’s still possible.
Malware
Malware (Malicious Software) are programs used by malicious actors to attack your system or to perform illegitimate actions on your system. Initially, malware doesn’t utilize high CPU resources to stay hidden but when they start performing malicious actions, they cause high CPU usage. I witnessed this incident where malware had been induced in a server a week before and one day it started transferring all sensitive data from the server to cloud storage. So, this malware didn’t use much CPU resources while it was setting up things and finding critical data. But once it found everything it needed, there was a huge spike in CPU usage due to data transfer. Using anti-malware, you will not only be fixing high CPU usage but also prevent high CPU usage due to malware.
Unoptimized Code
It’s common to have custom code running on servers for specific tasks. If such codes are not optimized, they might end up using a lot of CPU resources. Unoptimized loops and recursion are some of the most common causes for high CPU usage due to unoptimized code. User have to analyze the code and find out what part of the code is consuming CPU resources and optimize it.
Restart
A system restart is a solution for most computer problems. How would that help in reducing CPU usage? A restart would close all the background processes that might have started due to some action but you no longer need it. It would also terminate zombie processes or other processes that are indefinitely running due to malfunction. So restarting your system would clean all (at least most) of the unnecessary processes and reduce CPU usage.
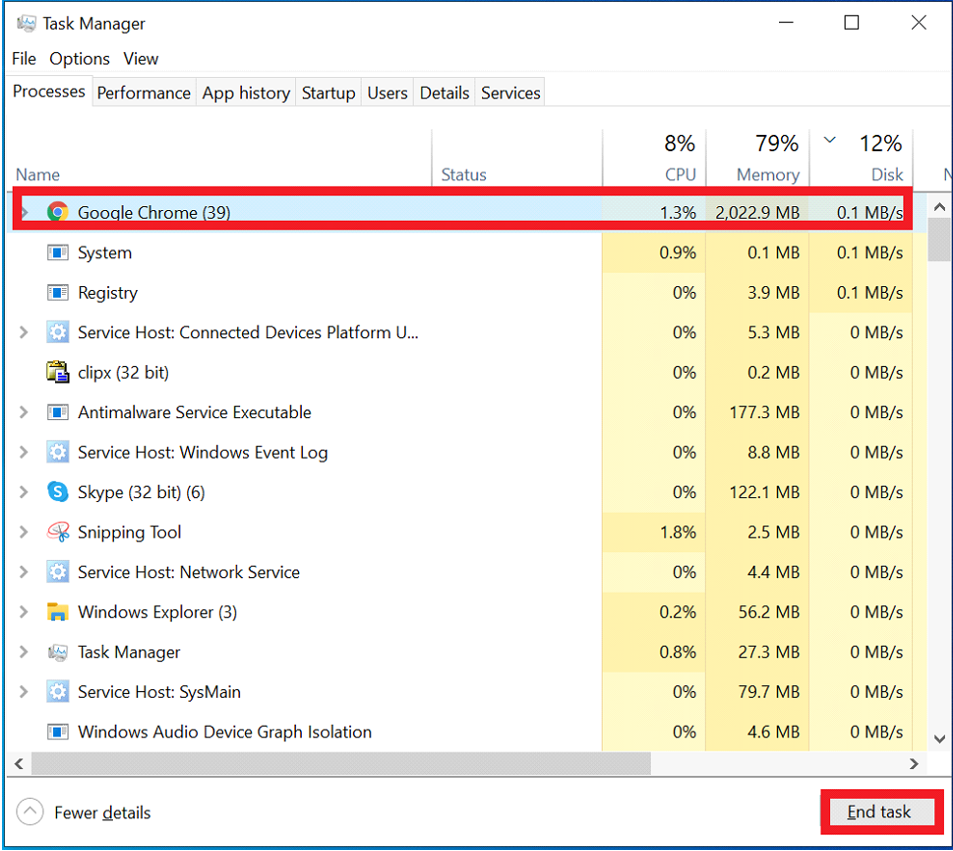
End Background Processes
Restarting the system might not be feasible especially for servers. So, you will have to handle unnecessary processes without restarting the system. To do this, you can list all the processes running, identify which processes are unnecessary, and end them. This is how it would look like in windows task manager:
CPU Upgrade
If you’ve fixed all the other problems and optimized everything and still see high CPU usage then it means that your CPU requirement is high. In such cases, there’s no other option than to upgrade your CPU resources.
Performance Monitor tool:
Performance Monitor (PerfMon) is a tool that comes built-in with Windows and allows you to look into the performance of your system and the applications that are running on it. It gives you a way to view data points that are associated with these applications and link them with the effect they have on your system. You can monitor data points both in real-time or collect them for analysis at a later time. Collection can also be scheduled for specific times of the day if there are only specific windows of time where you are experiencing an issue that you would like to monitor. Another important thing to note with the tool is it can also be used to monitor remote servers, not just the local server where the tool is running.
How to open PerfMon:
1.Open Start, do a search for Performance Monitor, and click the result.
2.Use the Windows key + R keyboard shortcut to open the Run command, type perfmon, and click OK to open.
3.Use the Windows key + X keyboard shortcut to open the Power User menu, select Computer Management, and click on Performance.
How to use Performance Monitor:
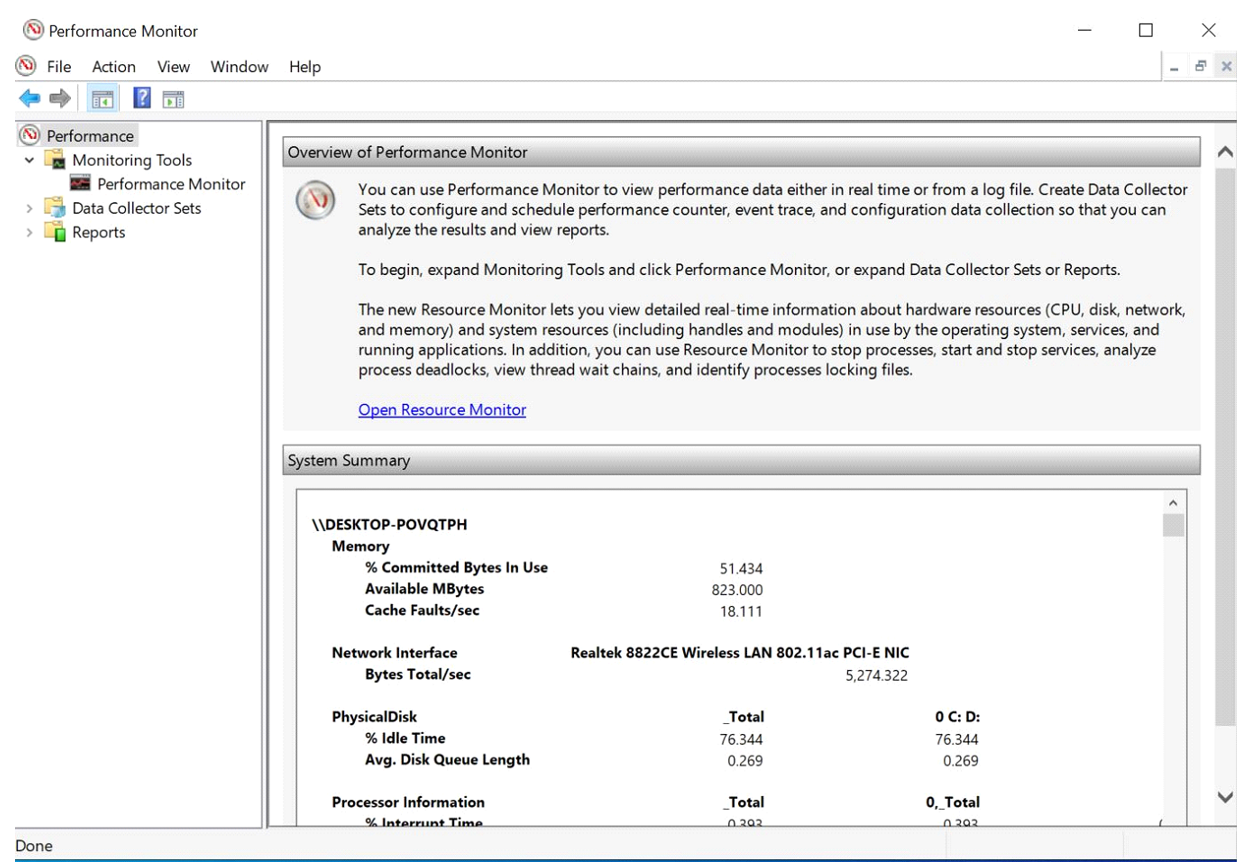
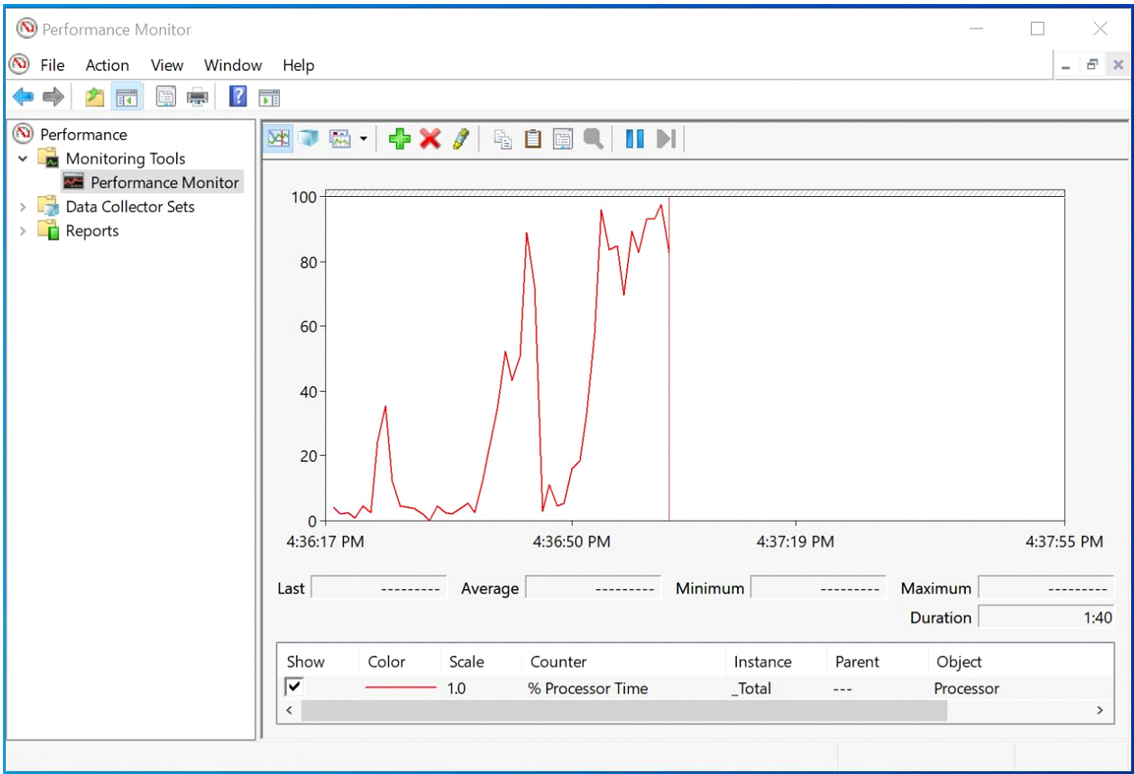
When you first open the tool, it’ll open in the main page with a brief overview, as well as a system summary with real-time data about memory, network adapter, physical disk, and processor usage.
On the left, you’ll find the navigation pane with access to Performance Monitor, Data Collector Sets, and Reports.Switching to Performance Monitor, you’ll see a screen with a single counter. This is typically the “Processor Time” counter, which displays the processor load in the last 100 seconds. However, the beauty of this tool is that you can add tons of other counters to monitor virtually anything on your computer.
Adding new counters
To add new counters to monitor applications and hardware performance on your computer, do the following:
1.Click the green plus button above the Performance Monitor graph
2.Select Local computer or the name of your computer from the drop-down menu.
3.Select and expand the category of the item you want to monitor. For example, for the purpose of this guide, select the “Network Adapter” category.
4.Select the counters you want to monitor (e.g., Bytes Total/sec).
Quick Tip: If you’re trying to add multiple counters, press and hold the Ctrl key and click to select each item you want to add. Also, you can check the Show description option to get more information about the counter you’re selecting.
5.If applicable, select the instances you want to monitor. For example, on Network Adapter, you can monitor one or multiple network adapters simultaneously.
6.Click the Add button.
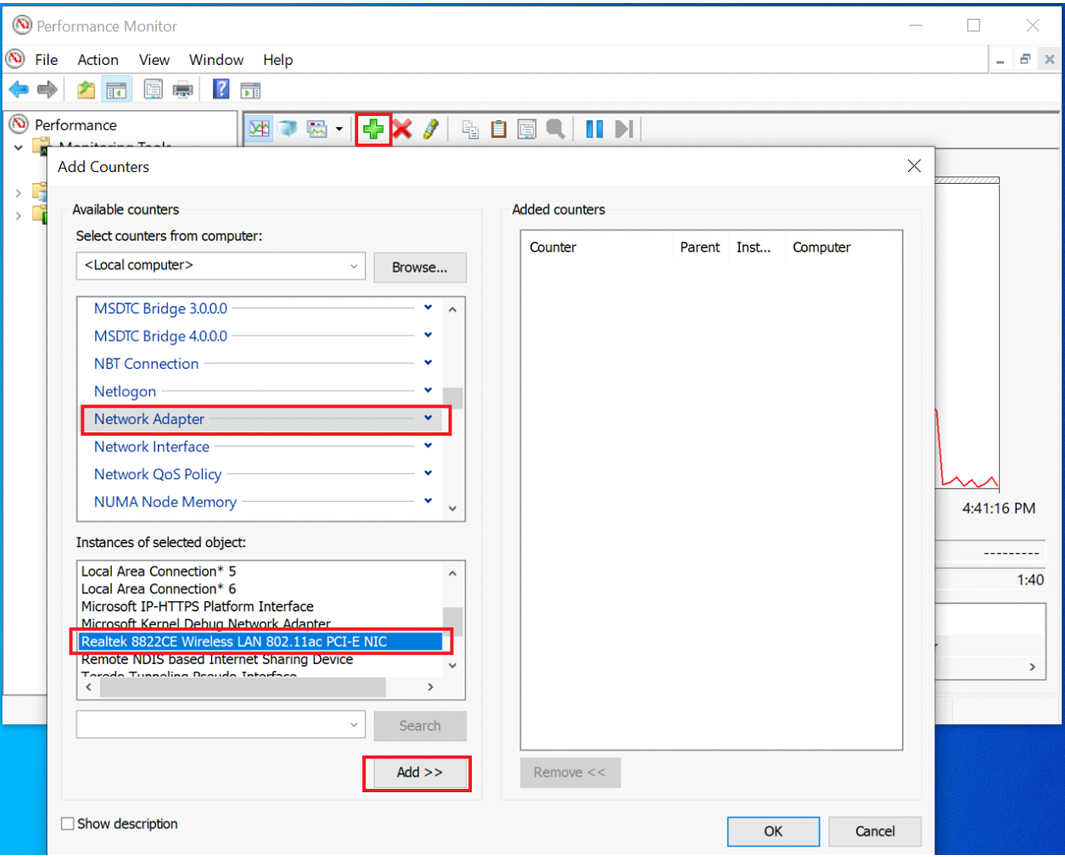
7.Click OK to confirm and add the new counters.
CrystalDiskMark:
CrystalDiskMark is an open source disk drive benchmark tool for Microsoft Windows. Based on Microsoft’s MIT-licensed Diskspd tool, this graphical benchmark is commonly used for testing the performance of solid-state storage. It works by reading and writing through the filesystem in a volume-dependent way.
Download crystaldiskmark from the below link:
https://crystalmark.info/en/software/crystaldiskmark/
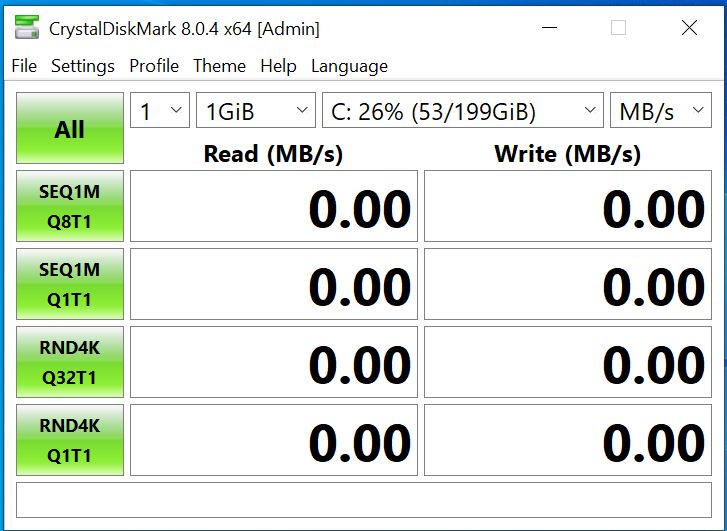
Across the top, the first three dropdowns should be:
1 – the number of test passes you want to run. If you want a fast seat-of-the-pants guess, do 1, but keep in mind it can be wildly variant between passes if something else happens to be going on in the SAN.
1GiB – the test file size. If you’re under the gun, do a quick 1GiB test, but for real go-live prep, I like using 32GB to reduce the chances that I’m just hitting cache and getting artificially fast numbers. Smaller test file sizes may look fast but don’t really reflect how a large database will work. Just know that the bigger the test file, the longer it takes to generate.
M: – the drive letter to test. Keep an eye on the free space there – you don’t want to create a test file that can run your server out of drive space. You want to test where your data, log, and TempDB files live, and for fun, also test the C drive and your desktop or laptop for comparison.
After making your choices, click the All button. While it runs, here’s an explanation of each row’s results:
SEQ Q1M Q8T1 – lots of long, sequential operations. For SQL Server, this is somewhat akin to doing backups or doing table scans of perfectly defragmented data, like a data warehouse.
SEQ1M Q1T1 – ignore, SQL Server doesn’t work like this.
RND 4K Q32T16 – random tiny operations, but many done at a time. This is somewhat akin to an active OLTP server, or a TempDB drive.
RND 4K Q1T1 – Ignore, SQL Server doesn’t work like this.
Interpreting CrystalDiskMark Results
For magnetic hard drives (individually or in RAID arrays), sequential operations (the top column) are often 10x-100x the rest of the results. This metric is often limited by how the computer is connected to the storage. Keep in mind that the MB/sec numbers commonly quoted by vendors are theoretical limits, and in practice, we’ve got 5%-20% overhead involved.
For solid state drives, the difference between sequential and random operations isn’t always as dramatic, but it can still be 2-3x. If there’s no difference, then I’d look even closer at the connectivity method – the SSDs are probably outperforming the connection method (like 3Gb SATA, 1Gb iSCSI, or 2/4Gb FC.)
If your server boots from a mirrored pair of local drives, and stores its SQL Server data somewhere else (like on a larger array or on a SAN), then test the local mirrored pair too. Compare the numbers for where you’re storing the valuable, high-performance data to where you’re storing the OS, and you might be surprised. Often I find that the OS’s drives perform even better because we just haven’t configured and tuned our storage.
Keep these original CrystalDiskMark screenshots in a shared folder for the group to access, and then challenge everyone involved to do better. Simple tuning techniques like tweaking the read/write bias on the RAID controller’s cache, right-sizing the NTFS allocation units, and working with different stripe sizes can usually yield double the storage performance without spending a dime.